Chapter 1.5 - Track model evolution with DVC
Introduction
In the previous chapter, you did set up a DVC pipeline to reproduce your experiment.
Once this stage is created, you will be able to change your model's configuration, evaluate the new configuration and compare its performance with the last committed ones.
In this chapter, you will learn how to:
- Update the parameters of the experiment
- Reproduce the experiment
- Visualize the changes made to the model
Let's get started!
Steps
Update the parameters of the experiment
Update your experiment with the following parameters by editing the
params.yaml file:
prepare:
  seed: 5241
  split: 0.2
  image_size: [32, 32]
  grayscale: True
  batch_size: 32

train:
  seed: 5241
  lr: 0.0001
  epochs: 10
  conv_size: 32
  dense_size: 64
  output_classes: 10
Check the differences with Git to validate the changes:
The output should be similar to this:
diff --git a/params.yaml b/params.yaml
index 0ddcde1..511198f 100644
--- a/params.yaml
+++ b/params.yaml
@@ -8,7 +8,7 @@ prepare:
 train:
   seed: 5241
   lr: 0.0001
-  epochs: 5
+  epochs: 10
   conv_size: 32
   dense_size: 64
   output_classes: 10
Here, you simply changed the epochs parameter of the Train stage, which should
slightly affect the model's performance.
Reproduce the experiment
Let's discover if these changes are positive or not! To do so, you will need to reproduce the experiment:
# Run the experiment. DVC will automatically run all required stages
dvc repro
Compare the two iterations
You will now use DVC to compare your changes with the last committed ones. For
DVC, HEAD refers to the last commit on the branch you are working on (at this
moment, the branch main), and workspace refers to the current state of your
working directory.
Note
Remember? You did set the parameters, metrics and plots in the previous chapter: Chapter 1.4: Reproduce the ML experiment with DVC.
Compare the parameters difference
In order to compare the parameters, you will need to use the dvc params diff.
This command will compare the parameters that were set on HEAD and the ones in
your current workspace:
The output should look like this:
DVC displays the differences between HEAD and workspace, so you can easily
compare the two iterations.
Compare the metrics difference
Similarly, you can use the dvc metrics diff command to compare the metrics
that were computed on HEAD and the ones that were computed in your current
workspace:
The output should look like this:
Path                     Metric     HEAD     workspace    Change
evaluation/metrics.json  f1_score   0.35362  0.45354      0.09992
evaluation/metrics.json  precision  0.31327  0.46571      0.15245
evaluation/metrics.json  recall     0.46431  0.55249      0.08818
evaluation/metrics.json  val_acc    0.44333  0.57333      0.13
evaluation/metrics.json  val_loss   1.77228  1.33433      -0.43795
Again, DVC shows you the differences, so you can easily compare the two iterations. Here, you can see that the metrics have slightly improved.
Compare the plots difference
Finally, you can use the dvc plots diff command to compare the plots that were
generated on HEAD and the ones that were generated in your current
workspace:
# Create the report to display the plots
dvc plots diff --open
Tip for WSL2 users
When using WSL2, this command will not succeed by default but the report is
available by clicking on the dvc_plots/index.html file.
The Linux distribution is accessible through the \\wsl.localhost\ address in
the file explorer. The current directory can also be opened directly from the
shell with the explorer.exe . command.
Warning
Do not enable auto-opening using the suggested command
dvc config plots.auto_open true, as this will cause complications in
subsequent steps.
The effect of the dvc plots diff command is to create a dvc_plots directory
in the working directory. This directory contains a report to visualize the
plots in a browser.
As for the other commands, DVC shows you the differences so you can easily compare the two iterations.
Here is a preview of the report:
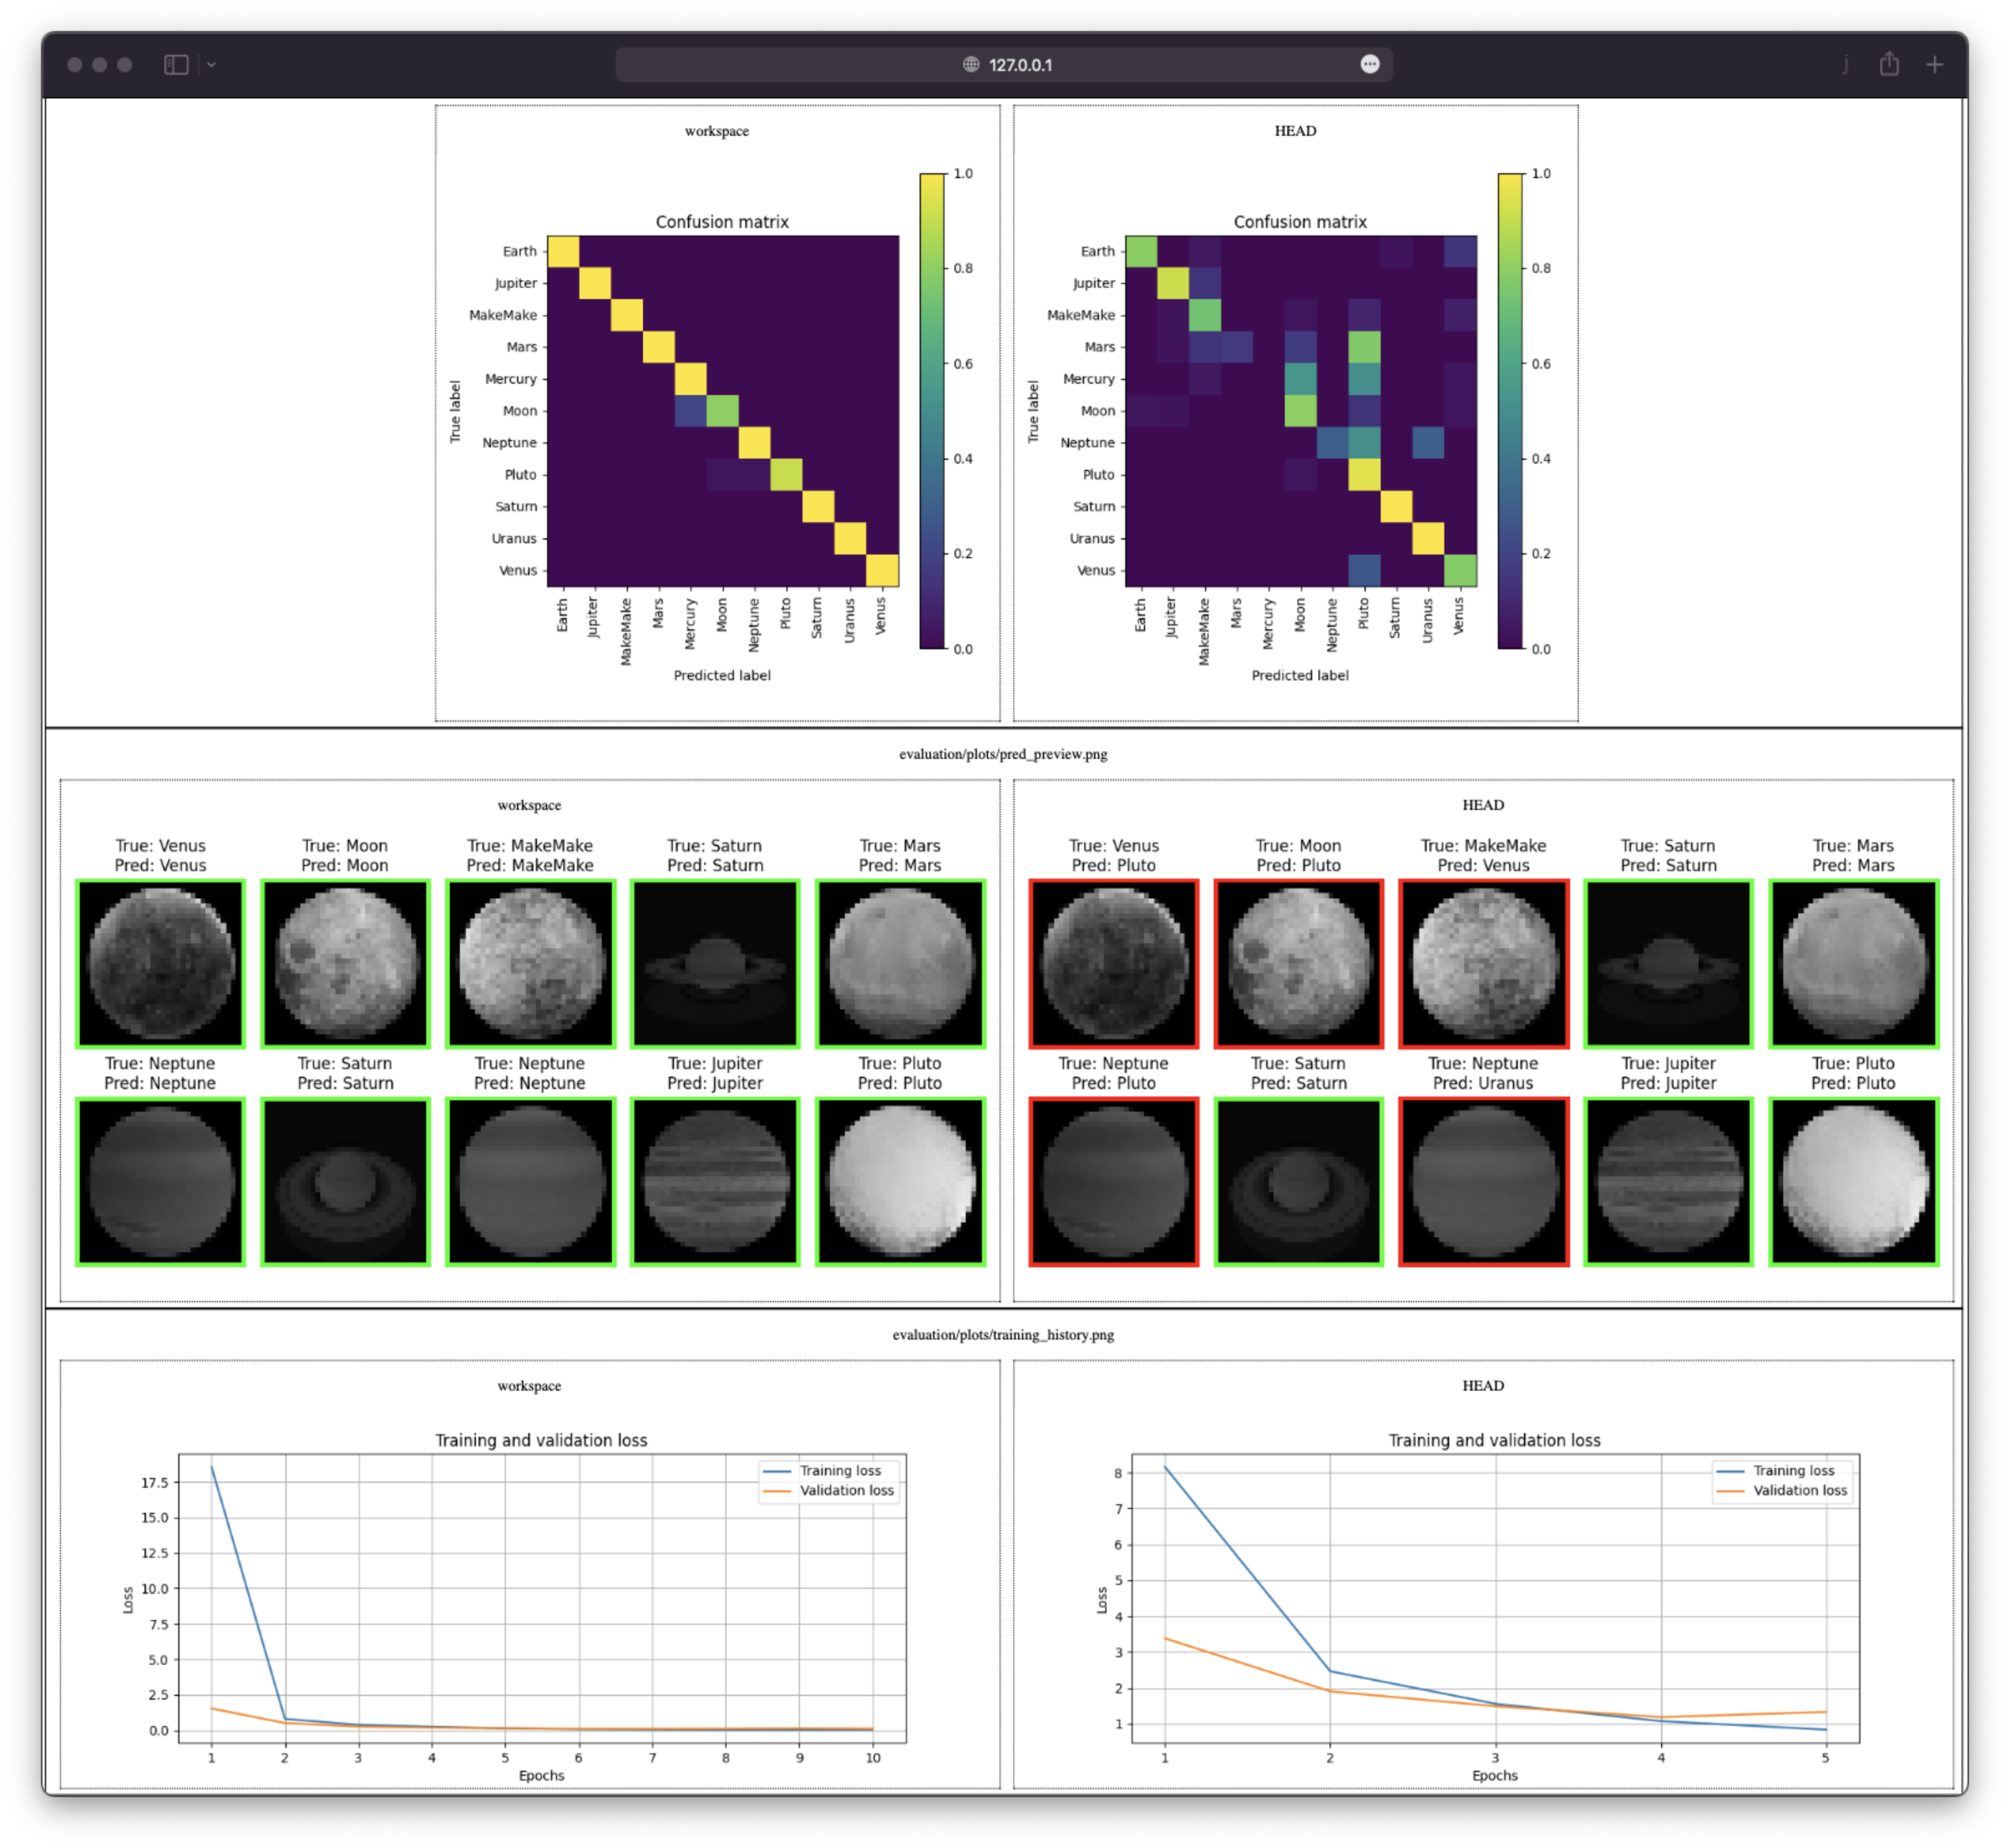
Summary of the model evolutions
You should notice the improvements made to the model thanks to the DVC reports. These improvements are small but illustrate the workflow. Try to tweak the parameters to improve the model and play with the reports to see how your model's performance changes.
Update the .gitignore file
The dvc plots diff creates a dvc_plots directory in the working directory.
This directory should be ignored by Git.
Add the dvc_plots directory to the gitignore file:
## Python
.venv/

# Byte-compiled / optimized / DLL files
__pycache__/

## DVC

# DVC plots
dvc_plots

# DVC will add new files after this line
/model
Info
If using macOS, you might want to ignore .DS_Store files as well to avoid
pushing Apple's metadata files to your repository.
Check the differences with Git to validate the changes:
The output should be similar to this:
diff --git a/.gitignore b/.gitignore
index 8a2668e..cbfa93b 100644
--- a/.gitignore
+++ b/.gitignore
@@ -6,5 +6,8 @@ __pycache__/

 ## DVC

+# DVC plots
+dvc_plots
+
 # DVC will add new files after this line
 /model
Check the changes
Check the changes with Git to ensure that all the necessary files are tracked:
# Add all the files
git add .

# Check the changes
git status
The output should look like this:
On branch main
Changes to be committed:
  (use "git restore --staged <file>..." to unstage)
        modified:   .gitignore
        modified:   dvc.lock
        modified:   params.yaml
Commit the changes
Commit the changes to the local Git repository:
# Commit the changes
git commit -m "Track changes of my ML experiment"
This chapter is done, you can check the summary.
Summary
Congratulations! You now have a simple way to compare the two iterations of your experiment.
In this chapter, you have successfully:
- Updated the experiment parameters
- Reproduced the experiment
- Visualized the changes made to the experiment
- Committed the changes
You fixed some of the previous issues:
- The changes done to a model can be visualized with parameters, metrics and plots to identify differences between iterations
You have solid metrics to evaluate the changes before integrating your work in the codebase.
Take away
- Comparing experiments is essential for data-driven decisions: DVC provides
dvc params diff,dvc metrics diff, anddvc plots diffto compare any two points in your experiment history (e.g., HEAD vs workspace, or any two commits), making it easy to evaluate whether changes improve your model. - Track parameters, metrics, and plots together: The combination of parameters (what you changed), metrics (quantitative results), and plots (visual results) gives you a complete picture of how model modifications affect performance.
- Version control for ML experiments enables safe experimentation: Just like Git allows you to experiment with code changes and revert if needed, DVC enables the same workflow for ML experiments. Try new approaches confidently knowing you can always go back.
- Visualizations make differences clear: The
dvc plots diff --opencommand generates an HTML report with side-by-side comparisons, making it easy to share results with team members and stakeholders without requiring them to run the experiments themselves.
State of the MLOps process
- Notebook has been transformed into scripts for production
- Codebase and dataset are versioned
- Steps used to create the model are documented and can be reproduced
- Changes done to a model can be visualized with parameters, metrics and plots to identify differences between iterations
Continue to the conclusion to review what you have learned.
Sources
Highly inspired by: